Characterization
How to Choose a Particle Size Analysis Method
A practical guide to choosing between laser diffraction, electron microscopy, dynamic light scattering and sieving, based on your sample, your size range and how the result will be used.
Published September 8, 2026
5 min read
NAKTEM Editorial Team
Last updated:
Why "particle size" is never a single number
Real powders and suspensions are not spheres. Every technique therefore reports an irregular particle as an "equivalent spherical diameter" defined by the physical quantity it actually measures. Laser diffraction reports the diameter of the sphere that would produce the same scattering pattern, microscopy reports a projected-area equivalent, and sieving reports the smallest aperture the particle can pass through. Different numbers for the same sample are not an error; they are a consequence of the method.
The second point is weighting. Laser diffraction produces a volume-weighted distribution, so a handful of large particles pulls the D50 upwards noticeably. Microscopy and dynamic light scattering produce number- or intensity-weighted results that make fine particles far more visible. A technically sound report should therefore state not only the D50 but also D10, D90, the span of the distribution and which weighting basis was used.
Before choosing a method, we recommend answering three questions. What size range do you expect? Will particle shape or agglomeration influence the result? Will the data be compared against a specification, or used to rank batches against each other? In most cases the answers point directly to the right technique, and they also tell the laboratory which dispersion conditions and reporting format will make the result useful to you.
Laser diffraction: the industrial workhorse
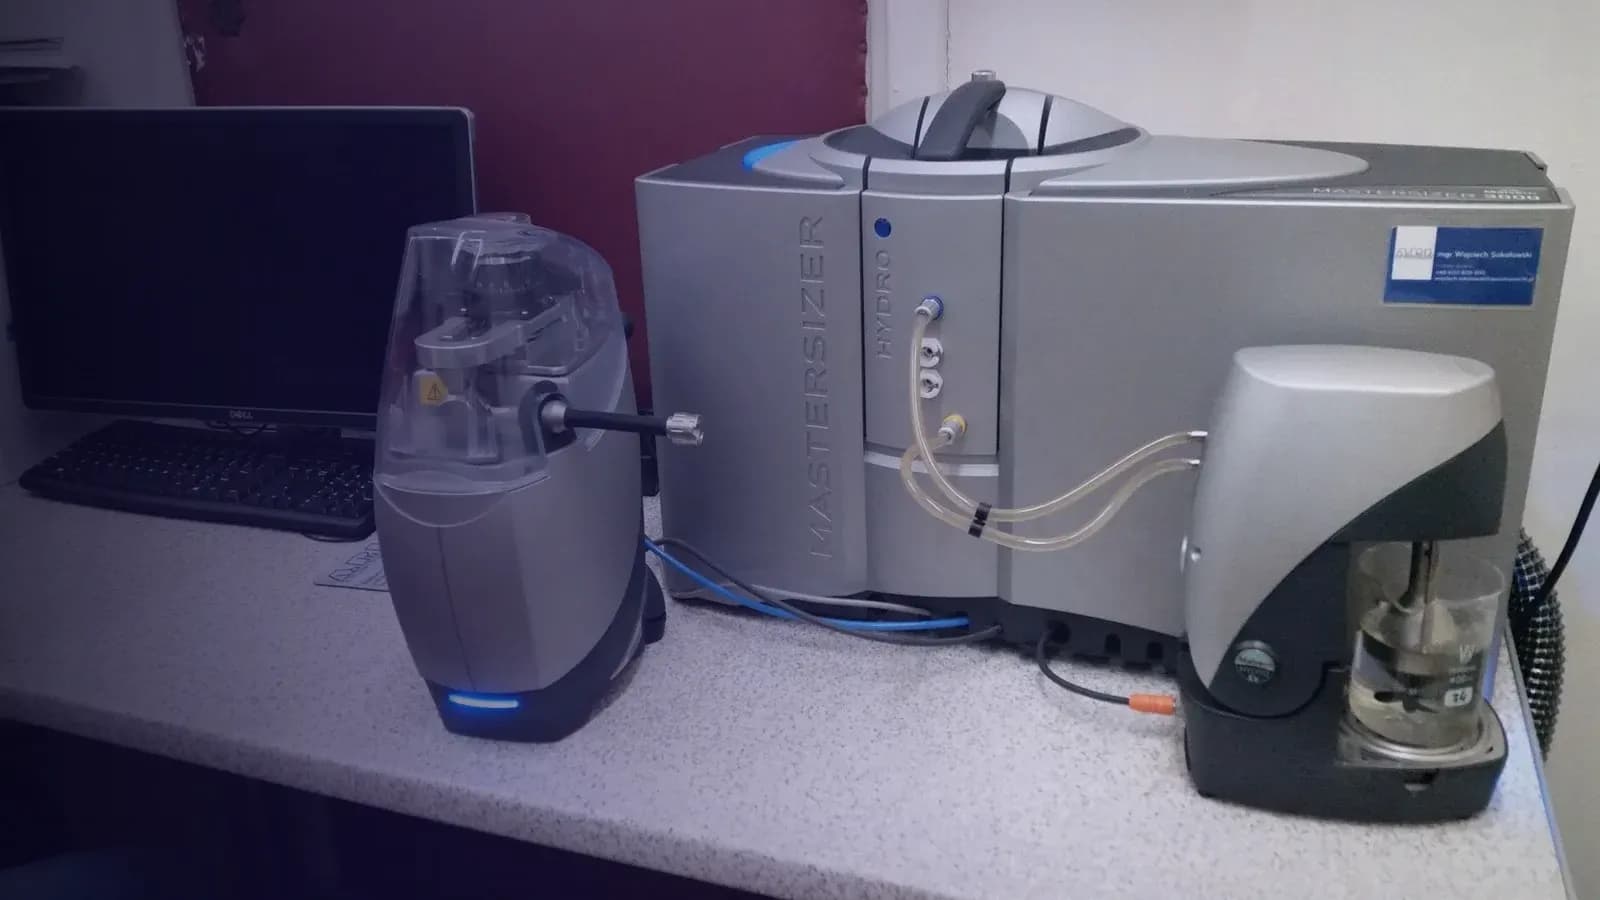
Laser diffraction (ISO 13320) covers a range from roughly ten nanometres to several millimetres in a single measurement and delivers a statistically robust, volume-weighted distribution within minutes. Wet dispersion handles suspensions, emulsions and powders that can be dispersed in water or an organic solvent; dry dispersion handles free-flowing powders. Its high repeatability makes it the natural choice for quality control and specification compliance.
The critical input is the optical model. Mie theory requires the refractive index of both particle and medium together with the absorption coefficient of the particle; for sub-micrometre material an incorrect index can shift the fine end of the distribution substantially. The Fraunhofer approximation is acceptable only for large, opaque particles. A sound report therefore states the optical model and the dispersion conditions used, including solvent, sonication time and stirrer speed.
Laser diffraction gives no information about particle shape and treats a tightly bound agglomerate as one large particle. An unexpectedly high D90 is more often a sign of incomplete dispersion than of genuinely coarse material. Cross-checking against SEM images is the most reliable way to resolve that ambiguity, and repeating the measurement after additional sonication quickly shows whether the coarse tail is stable or collapses.
When microscopy is the better answer
Scanning electron microscopy (SEM) images particles directly. Beyond size, it reveals shape, surface texture, the degree of agglomeration and the difference between primary particles and secondary clusters at a glance. For platelet, needle-like or fibrous materials the equivalent diameter from laser diffraction has little physical meaning, and image-based length and aspect-ratio measurements are far more informative.
The price of a size distribution from SEM is statistics. A number-weighted distribution that follows ISO 9276 principles requires hundreds of particles, and thousands for broad distributions, while sample preparation (dispersion, coating) influences the result. SEM is therefore rarely used as a stand-alone routine quality-control method; its real value is as a reference technique that validates and explains laser diffraction data.
At the nanometre scale SEM is often the only accessible direct method. A primary particle size below one hundred nanometres should never be confused with the hydrodynamic diameter obtained by light scattering; the difference between the two values is itself informative, since it reflects the stabiliser layer on the surface and the state of agglomeration in the dispersion.
Dynamic light scattering and sieving: the two ends of the range
Dynamic light scattering (DLS, ISO 22412) derives the hydrodynamic diameter from Brownian motion in dilute colloidal suspensions and performs best from a few nanometres to roughly one micrometre. Because it is intensity-weighted, a few large particles or traces of dust can dominate the result, and a single mean value is misleading for samples with a high polydispersity index. DLS is the typical choice for liposomes, polymeric nanoparticles and protein solutions.
Sieve analysis, using test sieves to the ISO 3310 series, occupies the coarse end of the range. For free-flowing granules and powders above approximately 45 micrometres it is economical, mass-weighted and easy to interpret, and the result maps directly onto industrial classification processes. Moist, electrostatic or platelet-shaped materials, however, cause sieve blinding and orientation effects that introduce serious errors.
A practical decision checklist
If the expected range lies between 0.1 and 1000 micrometres, the sample can be dispersed and the purpose is specification control or batch comparison, laser diffraction is the first choice. Add SEM when the particles are clearly non-spherical, agglomeration is suspected or the primary particle size is below one hundred nanometres. Use DLS for dilute colloidal suspensions below one micrometre and sieving for granules above 45 micrometres. In most development projects two complementary methods used together yield far more insight than any single one.
Whichever method is chosen, the report should document the sampling and sample-splitting procedure, dispersion conditions, optical model, number of repeat measurements and the weighting basis of the D10, D50 and D90 values. Without these details the results of two laboratories cannot be compared. At NAKTEM we evaluate the choice of method together with your sample and, where it adds value, present laser diffraction and SEM results side by side in one report.
NAKTEM Editorial Team
Technical Content TeamNext article
Author
- Technical Content Team
- NAKTEM Editorial Team
Related services
Analysis
Particle Size Distribution Analysis
Laser diffraction measurement of particle size distribution in powders, suspensions and emulsions from the nanometre to the millimetre range.
Analysis
SEM/EDS Imaging and Microanalysis
High-resolution surface imaging by scanning electron microscopy with elemental point, line and map analysis by energy-dispersive X-ray spectroscopy.
Sample preparation and processing
Milling and Particle Size Reduction
Planetary and high-energy ball milling for powder grinding, mechanical alloying, nanoscale size reduction and homogeneous blending of materials.
Related instruments
Particle and surface characterization
HORIBA Partica LA-960V2 Laser Diffraction Particle Size Analyser
Laser diffraction particle size distribution from 10 nm to 5 mm in wet or dry dispersion, supporting powder specification, formulation and quality control.
Microscopy and imaging
ZEISS EVO 10 Scanning Electron Microscope with Oxford EDS Detector
Nanometre-scale surface morphology imaging with simultaneous elemental mapping by energy-dispersive X-ray spectroscopy.
Particle and surface characterization
MicrotracBEL BELSORP MINI X Gas Adsorption (BET) Analyser with BELPREP VAC III Degassing Unit
Determination of BET specific surface area, pore volume and pore size distribution of powders and porous materials from gas adsorption isotherms.
Further reading
Characterization
FTIR or Raman: Which Technique Fits Your Sample?
FTIR and Raman probe the same molecular vibrations by different physics. A practical guide to choosing between them, what each needs from your sample, and how to read the resulting spectrum.
November 9, 20267 min readCharacterization
qPCR You Can Trust: Samples, Controls and Shipping
A trustworthy qPCR result is decided long before anything is pipetted into a plate. A practical, MIQE-aligned guide to sample integrity, controls, replicates and what to send to the laboratory.
November 9, 20267 min readCharacterization
BET Surface Area and Porosity: Degassing and Reading Isotherms
The reliability of a BET result is decided before the sample reaches the instrument. A practical guide to degassing, sample amount, isotherm types and the mistakes that most often spoil a measurement.
November 9, 20266 min read
Request this service
Describe your sample and the decision it supports. We reply with a technical proposal.